Loading [Contrib]/a11y/accessibility-menu.js
Skip to main content
null
Findings
  • Menu
  • Articles
    • Energy Findings
    • Resilience Findings
    • Safety Findings
    • Transport Findings
    • Urban Findings
    • All
  • For Authors
  • Editorial Board
  • About
  • Blog
  • covid-19
  • search

RSS Feed

Enter the URL below into your favorite RSS reader.

https://findingspress.org/feed
Transport Findings
February 12, 2021 AEST

The Impact of COVID-19 Cycling Infrastructure on Low-Stress Cycling Accessibility: A Case Study in the City of Toronto

Bo Lin, Timothy C. Y. Chan, Shoshanna Saxe,
covid-19 cycling infrastructurepop-up infrastructurecovid-19level of traffic stresscycling accessibility
Copyright Logoccby-sa-4.0 • https://doi.org/10.32866/001c.19069
Photo by Andre Furtado on Unsplash
Findings
Lin, Bo, Timothy C. Y. Chan, and Shoshanna Saxe. 2021. “The Impact of COVID-19 Cycling Infrastructure on Low-Stress Cycling Accessibility: A Case Study in the City of Toronto.” Findings, February. https:/​/​doi.org/​10.32866/​001c.19069.
Save article as...▾
Download all (3)
  • Figure 1: Multi-use trails, bike lanes and cycle tracks in the City of Toronto (Summer 2020).
    Download
  • Figure 2: The level of traffic stress for the cycling network without COVID cycling infrastructure.
    Download
  • Figure 3: Low-stress cycling accessibility at LTS2 for each DA in Toronto without and with COVID cycling infrastructure, and the difference between them.
    Download

Sorry, something went wrong. Please try again.

If this problem reoccurs, please contact Scholastica Support

Error message:

undefined

View more stats

Abstract

This paper investigates the impact of COVID-19 cycling infrastructure on Toronto’s low-stress cycling accessibility. We calculated the level of traffic stress (LTS) for the road network with and without the cycling infrastructure built in response to the COVID-19 pandemic. We then computed the accessibility to populations, jobs, food stores, and parks for each dissemination area at each LTS. We find that the COVID-19 cycling infrastructure increased low-stress population and job accessibility by 10.4% and 22.3% respectively, and granted food and park access to 54,023 and 3,178 people. Accessibility gains were largest in areas where new infrastructure linked with preexisting networks.

1. Questions

The COVID-19 pandemic accelerated construction of cycling infrastructure in cities around the world (City of Toronto 2020b; Alderman 2020; Jaramillo 2020). New COVID driven cycling infrastructure aims to provide safe, convenient, low-cost and non-polluting alternatives to driving and public transit, to facilitate lower risk outdoor activities, and to improve connections to essential services. Good quality cycling infrastructure is as a key driver of cycling mode choice (Dill and McNeil 2016).

Overall, 2020 saw surges in demand for cycling and cycling infrastructure in cities around the world (City of Toronto 2020a; Lock 2020; Lev 2020; Tokey 2020; Abdullah 2020; Wang and Noland 2021). However, there has been little quantitative analysis of the impact of this new infrastructure. In this paper, we quantify the impact of COVID cycling infrastructure, ranging from painted bike lanes to fully-separated cycle tracks, on access to areas, populations, jobs, food stores, and park spaces in low-stress cycling environments in Toronto, Canada.

2. Methods

The level of traffic stress (LTS) for each link in the Toronto road network was labelled as LTS1-4 following the approach of Furth, Mekuria, and Nixon (2016) and Imani, Miller, and Saxe (2019). LTS1 indicates low-stress roads for all cyclists including children. LTS2 roads are comfortable for the majority of the adult population. LTS3 for “enthused and confident” cyclists, and LTS4 for “strong and fearless” cyclists (Geller 2006). Link LTS was calculated based on road type and width, traffic speed and speed limits, motor vehicle volume during the morning peak period, and type (or absence of) cycling infrastructure.

We calculated intersection LTS according to the LTS of the intersecting roads, and the presence of stop signs or traffic signals. An intersection without either was assigned the highest LTS of its intersecting roads. Stop signs reduced an otherwise LTS2 intersection to LTS1. In Furth, Mekuria, and Nixon (2016), a signalized intersection maintained the stress of its lowest crossing link. Based on our observations in Toronto, we diverged from Furth, Mekuria, and Nixon (2016) and assigned LTS2 to signalized intersections where a low-stress (LTS1/2) link crosses a high-stress (LTS3/4) link. A signalized intersection of two low-stress links was assigned LTS1. We validated that this calculation resulted in accessibility measures that remained predictive of cycling mode choice (Data Management Group 2016).

Cycling accessibility was calculated following Imani, Miller, and Saxe (2019) using a 30-minute isochrone at each LTS for each census dissemination area (DA), and a 15 km/h travel speed. Cumulative opportunities for each DA were calculated at each LTS for five indicators: area, populations, jobs, food stores, and park area. A food store was considered accessible if its location was within the isochrone. A park was considered accessible if it intersected the isochrone. We focused on accessibility at LTS2 because it corresponds to the LTS tolerance of the mainstream population (Dill and McNeil 2016) and is predictive of mode choice (Imani, Miller, and Saxe 2019).

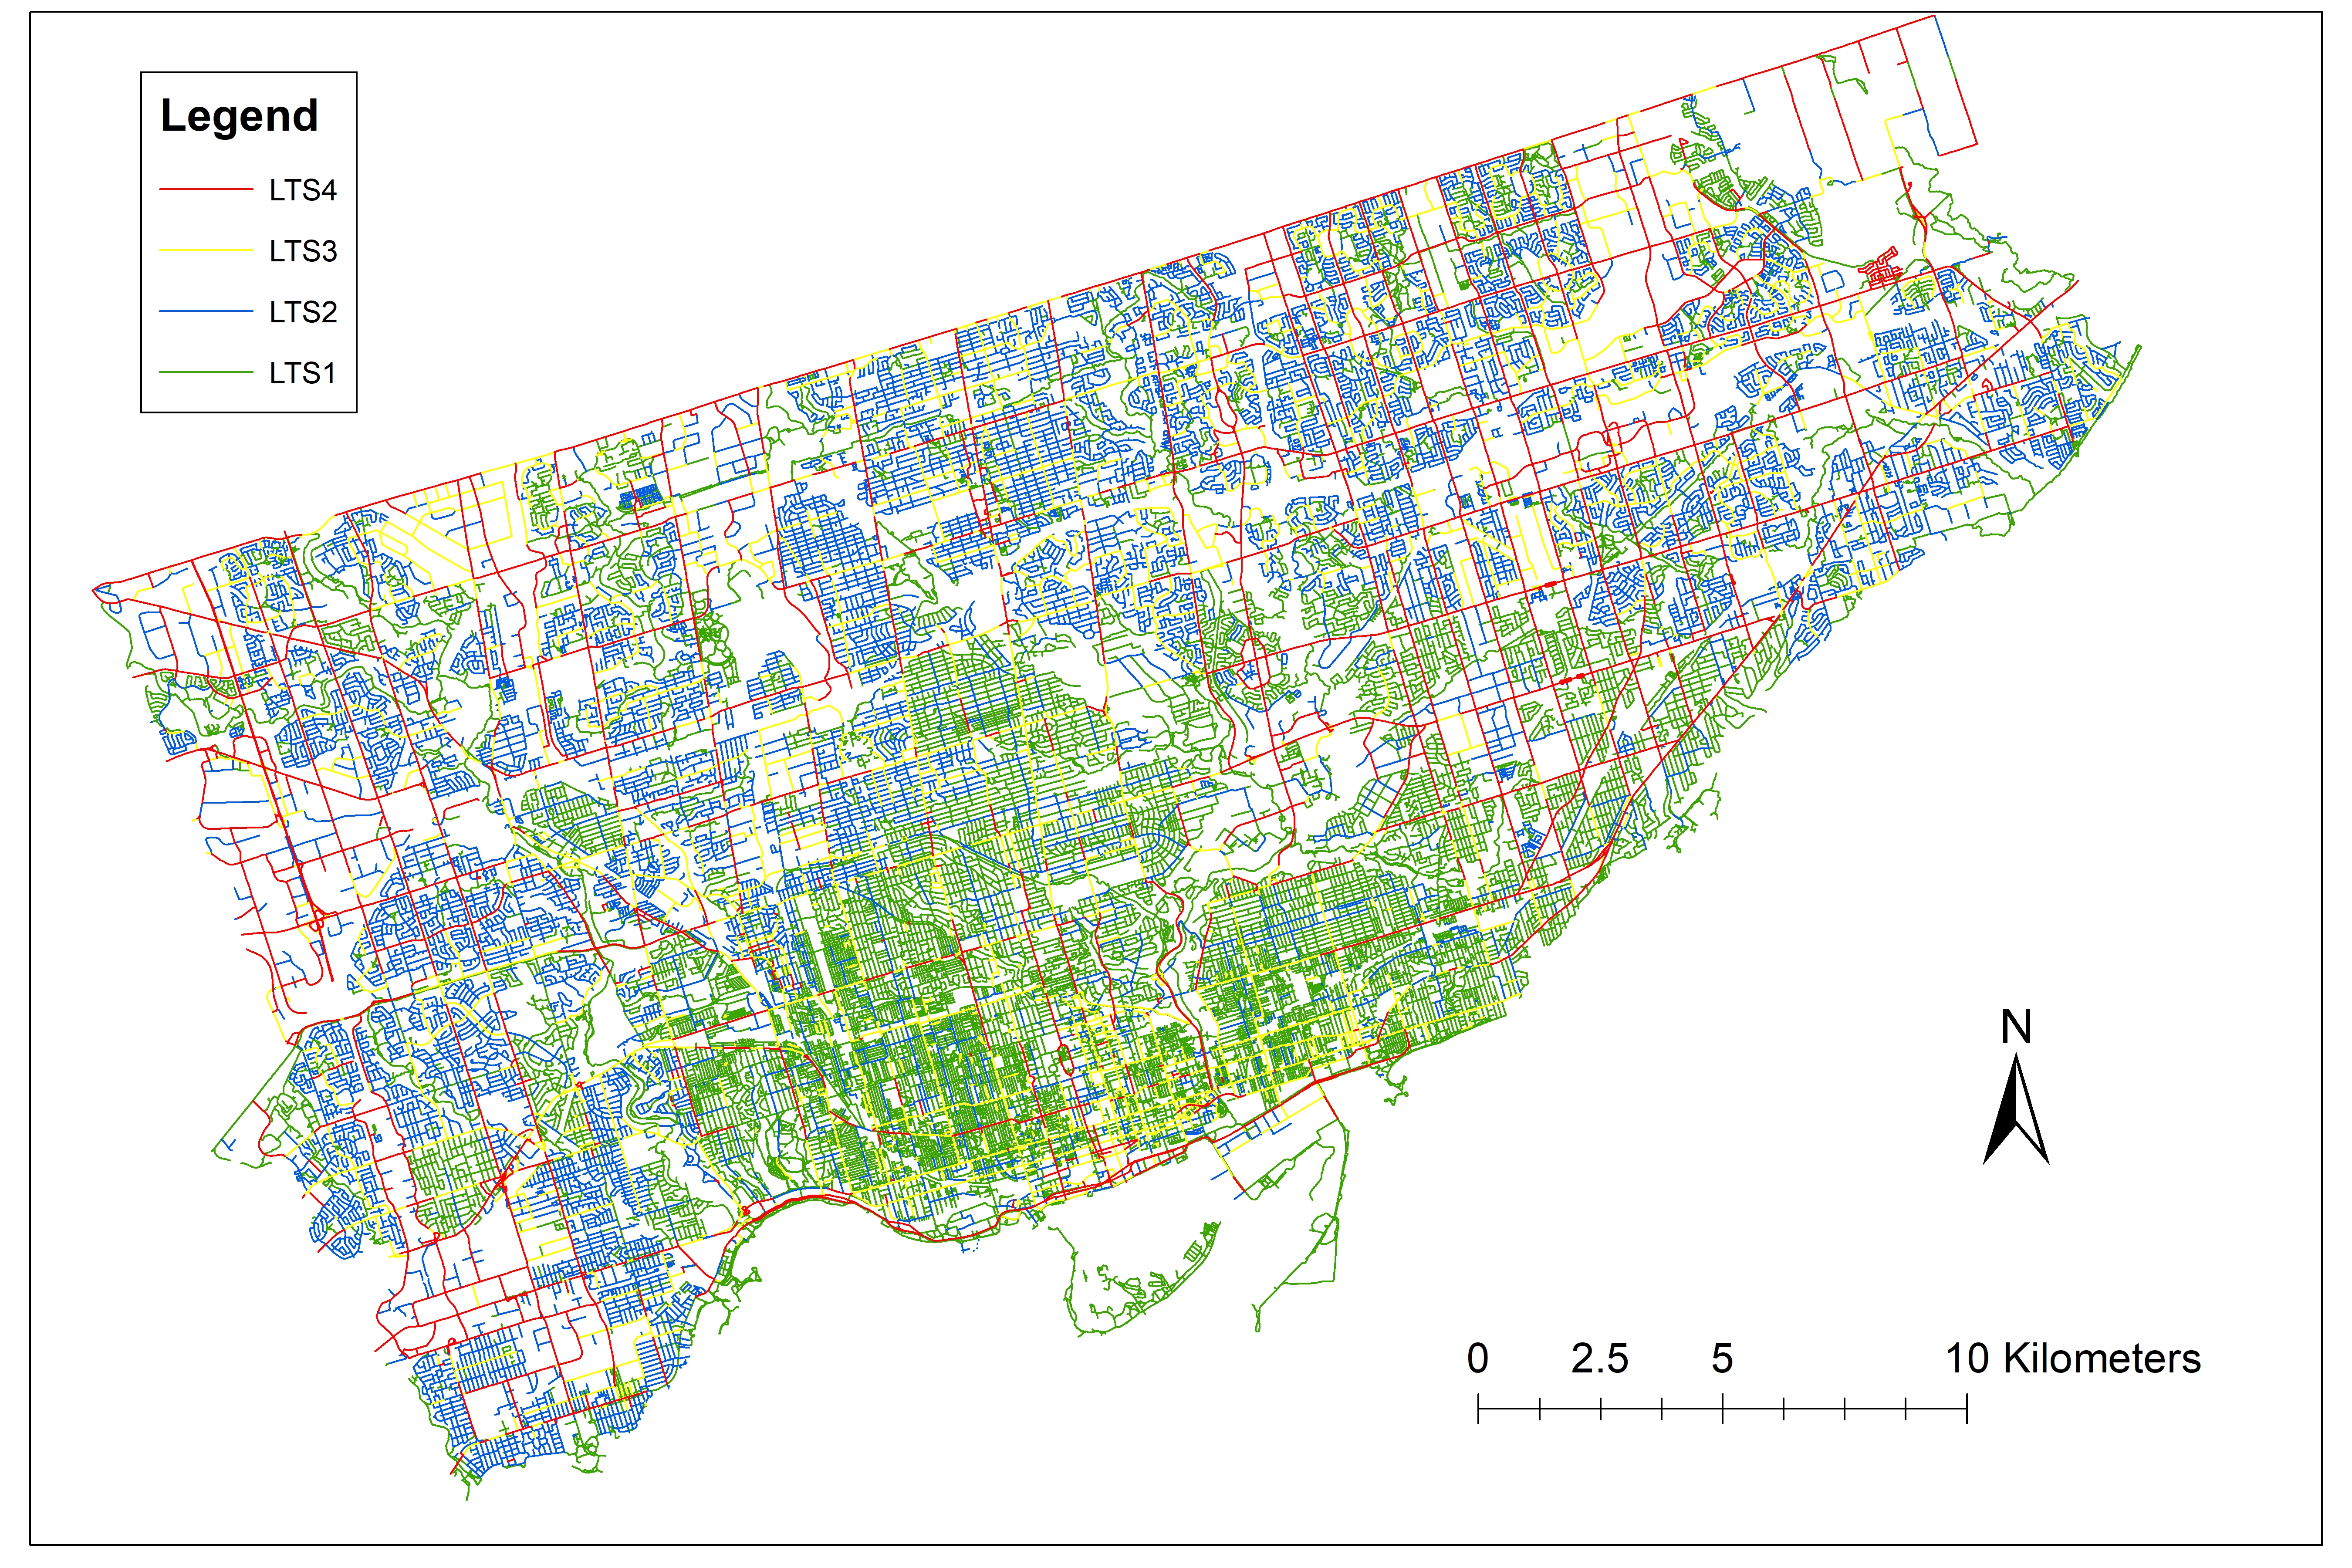
Our data sources are summarized in Table 1. The road and cycling infrastructure (Figure 1) types were defined by the City of Toronto and excluded roads where cycling is legally prohibited (e.g., expressways). Parking lanes were assessed only on roads where on-street parking machines are present. The population and employment data were aggregated to census dissemination areas (DAs), and were counted at the DA centroid. Food stores included supermarkets, grocery and convenience stores. Parks were defined as areas of open space with managed greenery (OpenStreetMap 2020). Data were integrated as a network in ArcGIS. The final network had 59,554 links totaling 6,658 km, 1,408 food stores, 1,566 parks totaling 72.3 km2, and 3,702 DAs with 2.7 million people and 1.5 million jobs.

Table 1:Data sources
Data Source
Road geometry and type Toronto Open Data Portal (City of Toronto 2020a)
Number of lanes Canada Open Data Portal (Government of Canada 2020)
Traffic speed and volume GTAModel V4 (Travel Modelling Group 2016)
Cycling infrastructure Toronto Open Data Portal (City of Toronto 2020a)
Parking machine location Toronto Parking Authority (Toronto Parking Authority 2020)
Stop sign location Open Street Map (OpenStreetMap 2020)
Traffic signal location Toronto Open Data Portal (City of Toronto 2020a)
DA geometry 2016 Canadian Census (Statistics Canada 2016)
Population 2016 Canadian Census (Statistics Canada 2016)
Employment Transportation Tomorrow Survey (Data Management Group 2016)
Food store location Open Street Map (OpenStreetMap 2020)
Park geometry and location Open Street Map (OpenStreetMap 2020)
Figure 1
Figure 1:Multi-use trails, bike lanes and cycle tracks in the City of Toronto (Summer 2020).

3. Findings

Figure 2 illustrates the cycling LTS in Toronto without the COVID cycling infrastructure. Although over 75% of the network consisted of LTS1/2 links, they were largely bounded by stressful arterials of LTS3/4, limiting low-stress cycling access. On average, the maximum possible cycling time at LTS2 was 14.6 minutes (Table 2), much less than the 30 minutes allotted by the methodology. Without COVID cycling infrastructure, the mean accessible population and jobs at LTS2 were 59,934 and 32,412, respectively, representing 13.0% and 11.4% of what would be possible if all city roads were low-stress (accessibility at LTS4). At LTS2, food stores and parks were inaccessible to 1,646 and 611 DAs, respectively, comprising 47.2% and 18.3% of the population.

Figure 2
Figure 2:The level of traffic stress for the cycling network without COVID cycling infrastructure.
Table 2:Cycling accessibility without COVID cycling infrastructure over all 3702 DAs in Toronto
LTS
1 ≤ 2 ≤ 3 ≤ 4
Travel time (min) Mean 3.6 14.6 26.9 30.0
Std. 4.4 12.0 8.1 0.5
Max 30.0 30.0 30.0 30.0
30-min isochrone area (km2) Mean 0.4 7.9 37.5 85.6
Std. 0.8 11.2 27.3 18.5
Max 4.9 39.1 94.5 116.9
Accessible population Mean 2,375 59,934 252,117 460,096
Std. 5,796 94,732 236,332 197,544
Max 33,268 379,051 807,414 885,172
Accessible jobs Mean 683 32,412 181,014 285,338
Std. 2,332 72,118 250,368 246,979
Max 28,558 423,330 746,341 799,201
Accessible food stores Mean 1.3 45.9 179.9 281.4
Std. 3.6 82.5 206.9 204.8
Max 23 372 648 708
# of Zeros 2,728 1,646 321 1
Accessible park area (km2) Mean 0.2 1.6 6.2 12.2
Std. 0.5 2.1 3.5 3.0
Max 4.0 7.8 12.9 18.8
# of Zeros 1,179 611 129 0

With COVID cycling infrastructure, we calculated that travel time and reachable area at LTS2 expanded by 4.1% and 7.6%, respectively (Table 3). This expansion corresponds to a 10-20% increase in population, job and food store accessibility, and a 6.3% increase in park accessibility. Figure 3 illustrates the changes in accessibility across Toronto. Accessibility increased around all COVID-19 cycling infrastructure, but gains were spatially heterogeneous. In some central locations, access increased by well over 100,000 people or jobs. Infrastructure in the north and east of the city provided new access to food and parks. Increases in accessibility occurred most intensively around central Toronto, with smaller gains in other parts of the city.

Table 3:Increase in accessibility due to COVID cycling infrastructure over all 3702 DAs in Toronto
LTS
1 ≤ 2 ≤ 3
Travel time (min) Mean 0.2 (5.6%) 0.6 (4.1%) 0.1 (0.3%)
Std. 0.1 (2.3%) 0.2 (1.6%) − 0.1 (1.2%)
Max 0.0 (0.0%) 0.0 (0.0%) 0.0 (0.0%)
30-min isochrone area (km2) Mean  < 0.1 (15.0%) 0.6 (7.6%) 0.8 (2.1%)
Std. 0.2 (25.0%) 0.5 (4.5%) 0.2 (0.7%)
Max 0.3 (6.1%) 0.4 (1.0%) 0.0 (0.0%)
Accessible population Mean 439 (18.5%) 6,216 (10.4%) 5,676 (2.3%)
Std. 1,198 (20.7%) 8,765 (9.3%) 3,583 (1.5%)
Max 5,906 (17.8%) 50,309 (13.3%) 15,461 (1.9%)
Accessible jobs Mean 127 (18.6%) 7,215 (22.3%) 5,383 (3.0%)
Std. 426 (18.3%) 20,497 (28.4%) 4,263 (1.7%)
Max 3,999 (14.0%) 25,931 (6.1%) 4,072 (0.5%)
Accessible food stores Mean 0.4 (30.1%) 5.8 (12.6%) 4.1 (2.3%)
Std. 1.3 (36.1%) 12.1 (14.7%) 3.7 (1.8%)
Max 9 (39.1%) 37 (9.9%) 7 (1.1%)
# of Zeros  − 6 (0.2%)  − 76 (4.6%) − 9 (2.8%)
Accessible park area (km2) Mean  < 0.1 (2.5%) 0.1 (6.3%) 0.1 (1.6%)
Std. 0.1 (20.0%)  < 0.1 (1.7%) < 0.1 (0.1%)
Max 0.0 (0.0%) 0.0 (0.0%) 0.4 (3.1%)
# of Zeros  − 1 (0.8%)  − 13 (2.1%) − 1 (0.8%)
Figure 3
Figure 3:Low-stress cycling accessibility at LTS2 for each DA in Toronto without and with COVID cycling infrastructure, and the difference between them.

Toronto has long had a spatial concentration of cycling infrastructure in downtown. The service provided by any new element of transport infrastructure is magnified by the existing infrastructure it connects to (Saxe and Kasraian 2020). While the COVID cycling infrastructure included new infrastructure in the east and north of the city, these areas remain early on the S-Curve of accessibility given the limited links with pre-existing cycling infrastructure. The concentration of food stores, jobs, and population in the central city intensifies this difference. As such, accessibility improved most in the central city and the COVID-19 cycling infrastructure would need to be augmented by additional infrastructure in the west, north and east of Toronto to see parallel gains in those regions. The part of the city that saw the largest accessibility increase corresponds to the more socially advantaged areas (Foth, Manaugh, and El-Geneidy 2013) echoing the challenging relationship between infrastructure distribution and socioeconomics in Toronto (Hosford and Winters 2018; El-Geneidy et al. 2016; Foth, Manaugh, and El-Geneidy 2013). This issue is exacerbated by the dominant lower density, automobile oriented land use patterns in those parts of the city, combined with a history of challenges in building and maintaining cycling infrastructure outside the central city. The Brimley Road COVID cycle tracks in east Toronto were removed in December 2020. Seventeen DAs with a combined population of 14,919 were provided new access to food stores by bike when those COVID cycle tracks were present. This area also had experienced some of the largest increases in access to park space in the city (>3 km2).

Overall, the accessibility impacts of the COVID cycling infrastructure in Toronto were large, if uneven. A longer selected travel time or a faster cycling speed would increase the estimated accessibility gains. Nevertheless, the main barrier to cycling accessibility in much of Toronto remains limited and disconnected cycling infrastructure.


Acknowledgments

This research was supported by funding from the City of Toronto.

Submitted: January 23, 2021 AEST

Accepted: February 03, 2021 AEST

References

Abdullah, Z. 2020. “Singapore Sees Cycling Boom amid COVID-19, with Increased Ridership and Bicycle Sales.” Channel News Asia, 2020. https:/​/​www.channelnewsasia.com/​news/​singapore/​covid-19-cycling-popularity-bicycle-sales-shared-bikes-13034350.
Alderman, L. 2020. “Corona Cycleways’ Become the New Post-Confinement Commute.” The New York Times, 2020. https:/​/​www.nytimes.com/​2020/​06/​12/​business/​paris-bicycles-commute-coronavirus.html.
City of Toronto. 2020a. “City of Toronto Open Data.” https:/​/​www.toronto.ca/​city-government/​data-research-maps/​open-data/​.
———. 2020b. “COVID-19: Expanding the Cycling Network.” https:/​/​www.toronto.ca/​home/​covid-19/​covid-19-protect-yourself-others/​covid-19-reduce-virus-spread/​covid-19-activeto/​covid-19-activeto-expanding-the-cycling-network/​.
Data Management Group. 2016. “Transportation Tomorrow Survey.” Toronto, Ontario, Canada. http:/​/​www.transportationtomorrow.on.ca.
Dill, Jennifer, and Nathan McNeil. 2016. “Revisiting the Four Types of Cyclists: Findings from a National Survey.” Transportation Research Record: Journal of the Transportation Research Board 2587 (1): 90–99. https:/​/​doi.org/​10.3141/​2587-11.
Google Scholar
El-Geneidy, Ahmed, Ron Buliung, Ehab Diab, Dea van Lierop, Myriam Langlois, and Alexander Legrain. 2016. “Non-Stop Equity: Assessing Daily Intersections between Transit Accessibility and Social Disparity across the Greater Toronto and Hamilton Area (GTHA).” Environment and Planning B: Planning and Design 43 (3): 540–60. https:/​/​doi.org/​10.1177/​0265813515617659.
Google Scholar
Foth, Nicole, Kevin Manaugh, and Ahmed M. El-Geneidy. 2013. “Towards Equitable Transit: Examining Transit Accessibility and Social Need in Toronto, Canada, 1996-2006.” Journal of Transport Geography 29 (May):1–10. https:/​/​doi.org/​10.1016/​j.jtrangeo.2012.12.008.
Google Scholar
Furth, Peter G., Maaza C. Mekuria, and Hilary Nixon. 2016. “Network Connectivity for Low-Stress Bicycling.” Transportation Research Record: Journal of the Transportation Research Board 2587 (1): 41–49. https:/​/​doi.org/​10.3141/​2587-06.
Google Scholar
Geller, R. 2006. “Four Types of Cyclists.” https:/​/​www.portlandoregon.gov/​transportation/​article/​264746.
Government of Canada. 2020. “Government of Canada Open Data.” https:/​/​open.canada.ca/​en/​open-data.
Hosford, Kate, and Meghan Winters. 2018. “Who Are Public Bicycle Share Programs Serving? An Evaluation of the Equity of Spatial Access to Bicycle Share Service Areas in Canadian Cities.” Transportation Research Record: Journal of the Transportation Research Board 2672 (36): 42–50. https:/​/​doi.org/​10.1177/​0361198118783107.
Google Scholar
Imani, Ahmadreza Faghih, Eric J. Miller, and Shoshanna Saxe. 2019. “Cycle Accessibility and Level of Traffic Stress: A Case Study of Toronto.” Journal of Transport Geography 80 (October):102496. https:/​/​doi.org/​10.1016/​j.jtrangeo.2019.102496.
Google Scholar
Jaramillo, A. 2020. “Bogotá Is Building Its Future around Bikes.” Bloomberg, 2020. https:/​/​www.bloomberg.com/​news/​articles/​2020-08-10/​to-tame-traffic-bogot-bets-big-on-bike-lanes.
Lev, E. 2020. “Cycling Demand Skyrockets as Canadians Look for Transport Alternatives.” Yahoo News, 2020. https:/​/​ca.news.yahoo.com/​biking-sees-spike-thanks-to-covid-19-203607754.html.
Lock, Oliver. 2020. “Cycling Behaviour Changes as a Result of COVID-19: A Survey of Users in Sydney, Australia.” Findings, June. https:/​/​doi.org/​10.32866/​001c.13405.
Google Scholar
OpenStreetMap. 2020. “Open Street Map.” 2020. https:/​/​www.openstreetmap.org.
Saxe, S., and D. Kasraian. 2020. “Rethinking Environmental LCA Life Stages for Transport Infrastructure to Facilitate Holistic Assessment.” Journal of Industrial Ecology 24:1031–46. https:/​/​doi.org/​10.1111/​jiec.13010.6.
Google Scholar
Statistics Canada. 2016. “Population and Dwelling Count, 2016 Census.” https:/​/​www12.statcan.gc.ca/​census-recensement/​2016/​dp-pd/​hlt-fst/​pd-pl/​Table.cfm?Lang=Eng&T=1902&PR=35&S=3&O=D&RPP=50.
Tokey, Ahmad Ilderim. 2020. “Change of Bike-Share Usage in Five Cities of United States during Covid-19.” Findings, November. https:/​/​doi.org/​10.32866/​001c.17851.
Google Scholar
Toronto Parking Authority. 2020. “Personal Communication.”
Travel Modelling Group. 2016. “GTAModel V4 Introduction.” https:/​/​tmg.utoronto.ca/​doc/​1.6/​gtamodel/​index.html.
Wang, Haoyun, and Robert Noland. 2021. “Changes in the Pattern of Bikeshare Usage Due to the Covid-19 Pandemic.” Findings, January. https:/​/​doi.org/​10.32866/​001c.18728.
Google Scholar

This website uses cookies

We use cookies to enhance your experience and support COUNTER Metrics for transparent reporting of readership statistics. Cookie data is not sold to third parties or used for marketing purposes.

Powered by Scholastica, the modern academic journal management system